
- A1C shows your average blood sugar over the past two to three months. Blood glucose shows what it is at this moment.
- For many adults with type 2 diabetes, a common A1C goal is below 7%, but your goal should be personal.
- With a continuous glucose monitor (CGM), time in range (aiming for more than 70% of the day between 70 and 180 mg/dL) adds detail that A1C cannot show.
People with diabetes collect a lot of numbers. Two of the most important are A1C and blood glucose, and they are often confused. They measure the same thing, sugar in the blood, but over completely different time scales. Think of glucose readings as photographs and A1C as a summary of a three-month film. You need both to understand the story.
A1C: the three-month average
Glucose in your blood sticks to hemoglobin, the protein in red blood cells, and stays attached for the life of the cell, about three months. The A1C test measures what percentage of hemoglobin is “sugar-coated”. Higher average blood sugar means a higher A1C.
Because it is an average, A1C is excellent for tracking progress and judging long-term risk. Every drop in A1C lowers the risk of eye, kidney and nerve damage. It is usually checked every three months when treatment is changing, and at least twice a year when you are at goal.
What A1C cannot tell you is how much your blood sugar swings. Two people can both have an A1C of 7%: one with steady readings, the other bouncing between lows and highs.
Blood glucose: the snapshot
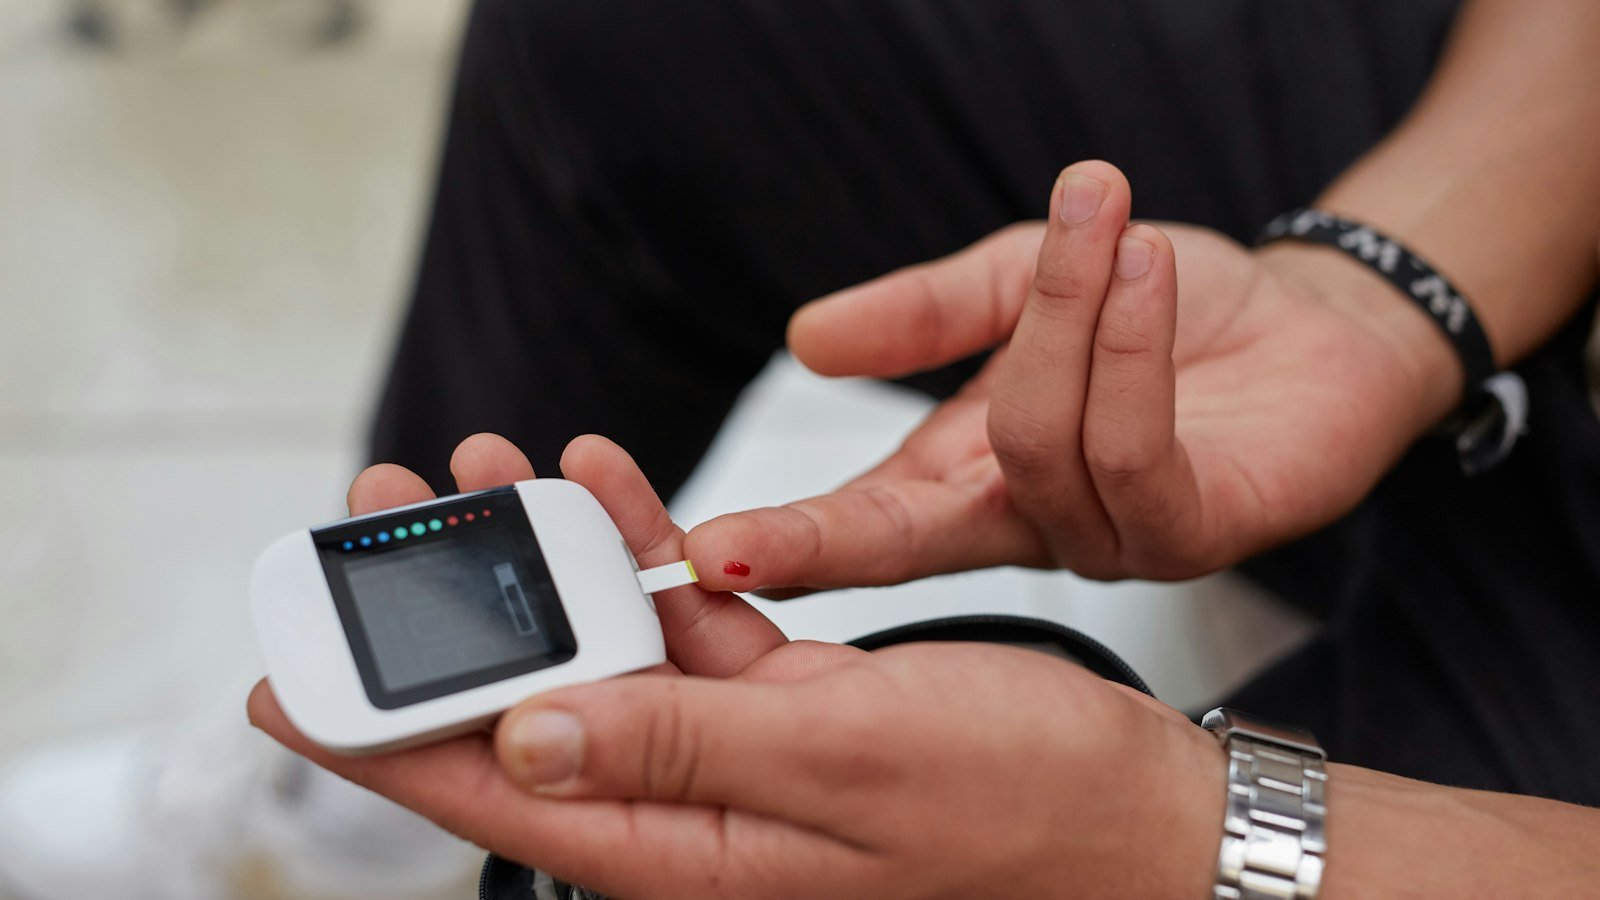
A fingerstick meter or a CGM measures glucose right now, in mg/dL (or mmol/L in many countries). It changes minute to minute with food, activity, stress, sleep, illness and medicines. These readings help you make day-to-day decisions: how a meal affected you, whether a walk helped, or whether a low needs treating.
How A1C translates into average glucose
A1C can be converted into an estimated average glucose (eAG) in the same units as your meter, using a formula from the international A1C-Derived Average Glucose study:
A1C and estimated average glucose
Average glucose in mg/dL. eAG = 28.7 × A1C − 46.7 (Nathan et al., 2008). Divide by 18 for mmol/L.
If your meter readings seem much lower than your A1C suggests, you may be missing high readings after meals or overnight. If they seem higher, it may be worth checking your meter technique, or asking whether something is affecting your A1C, such as anemia.
Common targets
| Measure | Common goal for many adults |
|---|---|
| A1C | Below 7% (53 mmol/mol) |
| Glucose before meals | 80–130 mg/dL (4.4–7.2 mmol/L) |
| Glucose 1–2 hours after starting a meal | Below 180 mg/dL (10.0 mmol/L) |
| Time in range (70–180 mg/dL) on a CGM | More than 70% of readings |
| Time below range (under 70 mg/dL) | Less than 4%, and less than 1% under 54 mg/dL |
These are starting points, not rules. The American Diabetes Association recommends individual goals. A tighter A1C goal (such as below 6.5%) may suit someone recently diagnosed on medicines that do not cause lows. A looser goal (such as below 8%) is often safer for older adults, people with frequent low blood sugar, or those with serious other illnesses.
Time in range: the newer measure
If you use a CGM, your report will show time in range (TIR): the percentage of the day your glucose stayed between 70 and 180 mg/dL (3.9–10.0 mmol/L). International consensus sets a goal of more than 70% for most adults, roughly the same as an A1C of about 7%. The consensus panel considers even a 5% increase in time in range (about 1 extra hour a day) clinically meaningful.
70–180 mg/dL
over 180 mg/dL
under 70 mg/dL
Consensus targets for most adults with type 1 or type 2 diabetes (Battelino et al., 2019).
Time in range also highlights patterns an A1C hides, such as a steady rise overnight or a spike after breakfast, so you and your care team can target changes precisely. Read more in Digital Tools for Diabetes.
MythA good A1C means my blood sugar is always fine.
FactA1C is an average. Frequent highs and lows can balance out to a “good” number. Glucose readings or CGM data show what the average hides.
Putting it together
- Use A1C to judge the overall trend every few months.
- Use glucose readings to learn how your daily choices affect you, and to catch lows.
- Use time in range, if you have a CGM, to see the full daily pattern.
- Bring all three to appointments. Together, they tell your care team whether your plan is working.
Common questions
How often should I check my blood sugar at home?
It depends on your treatment. People on insulin usually check several times a day or use a CGM. People on tablets that do not cause lows may check less often, for example a few times a week at different times, or before and after meals when trying changes. Agree a plan with your care team so each reading has a purpose.
Why is my morning glucose high when I did not eat overnight?
Early in the morning, hormones such as cortisol and growth hormone tell the liver to release glucose, the so-called dawn phenomenon. In type 2 diabetes, insulin cannot fully counter this. A late large meal, snacking, poor sleep or medicine timing can also contribute. Tell your care team if fasting readings are consistently above target.
- A1C is a three-month average; glucose is a moment in time.
- An A1C of 7% equals an average glucose of about 154 mg/dL (8.6 mmol/L).
- Many adults aim for A1C below 7% and time in range above 70%, but goals should be personal.
- Next: Diabetes and your heart.
Type 2 Diabetes Basics: all 18 articles
- What Is Type 2 Diabetes?
- Type 2 Diabetes Risk Factors
- Early Signs and Symptoms
- How Type 2 Diabetes Is Diagnosed
- A1C vs Blood Glucose
- Diabetes and Your Heart
- Preventing Long-Term Complications
- Type 2 Diabetes Medicines Explained
- GLP-1 Medicines: What to Expect
- Taking Your Medicines Consistently
- When Your Diabetes Changes
- Digital Tools: Meters, CGMs and Apps
- How to Read a Nutrition Label
- Carb Counting Made Simple
- Small Food Swaps for Lower Blood Sugar
- Travelling With Diabetes
- Diabetes Distress and Depression
- Caring for Someone With Type 2 Diabetes
Sources
- Nathan DM, Kuenen J, Borg R, et al. Translating the A1C assay into estimated average glucose values. Diabetes Care. 2008;31(8):1473–1478.
- Battelino T, Danne T, Bergenstal RM, et al. Clinical targets for continuous glucose monitoring data interpretation: recommendations from the International Consensus on Time in Range. Diabetes Care. 2019;42(8):1593–1603.
- American Diabetes Association Professional Practice Committee. 6. Glycemic Goals, Hypoglycemia, and Hyperglycemic Crises: Standards of Care in Diabetes—2026. Diabetes Care. 2026;49(Suppl 1):S132.
- National Institute of Diabetes and Digestive and Kidney Diseases. The A1C Test & Diabetes.
- UK Prospective Diabetes Study Group; Stratton IM, et al. Association of glycaemia with macrovascular and microvascular complications of type 2 diabetes (UKPDS 35). BMJ. 2000;321:405–412.
This article is for general education and is not a substitute for advice from your own doctor, diabetes educator or pharmacist.